Lessons
Lesson #1: Rhythm Analysis - 5 Steps
Intro
Rhythm analysis using a 5 step method will be practiced in this section. Analyze tracings in the following order.
- Rhythm Regularity
- Heart Rate
- P wave morphology
- P R interval or PRi
- QRS complex duration and morphology
Step 1
Rhythm Regularity
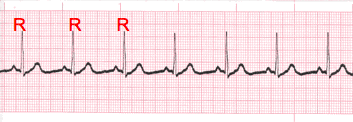
- Carefully measure from the tip of one R wave to the next, from the beginning to the end of the tracing.
- A rhythm is considered “regular or constant” when the distance apart is either the same or varies by 1 ½ small boxes or less from one R wave to the next R wave.
Step 2
Heart Rate Regular (Constant) Rhythms

- The heart rate determination technique used will be the 1500 technique.
- Starting at the beginning of the tracing through the end, measure from one R wave to the next R wave (ventricular assessment), then P wave to P wave (atrial assessment), then count the number of small boxes between each and divide that number into 1500. This technique will give you the most accurate heart rate when analyzing regular heart rhythms. You may include ½ of a small box i.e. 1500/37.5 = 40 bpm (don’t forget to round up or down if a portion of a beat is included in the answer).
Step 2-2
Heart Rate - Irregular Rhythms

- If the rhythm varies by two small boxes or more, the rhythm is considered “irregular”.
- The heart rate determination technique used for irregular rhythms will be the “six-second technique”.
- Simply count the number of cardiac complexes in six seconds and multiply by ten.
Step 3
P wave Morphology (shape)

- Lead II is most commonly referenced in cardiac monitoring
- In this training module, lead two will specifically be referenced unless otherwise specified.
Step 4
PR interval (PRi)
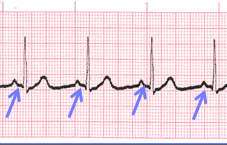 Constant PR Interval
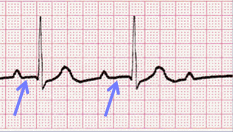 Variable PR Interval
- Measurement of the PR interval reflects the amount of time from the beginning of atrial depolarization to the beginning of ventricular depolarization.
- Plainly stated, this measurement is from the beginning of the P wave to the beginning of the QRS complex.
- The normal range for PR interval is: 0.12 – 0.20 seconds (3 to 5 small boxes)
- It is important that you measure each PR interval on the rhythm strip.
- Some tracings do not have the same PRi measurement from one cardiac complex to the next. Sometimes there is a prolonging pattern, sometimes not.
- If the PR intervals are variable, report them as variable, but note if a pattern is present or not.
Step 5
QRS complex
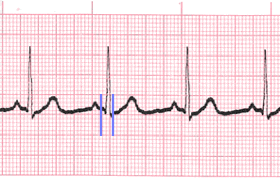
- QRS represents ventricular depolarization.
- It is very important to analyze each QRS complex on the tracing and report the duration measurement and describe the shape (including any changes in shape).
- As discussed in step 3, when referring to P waves, remember changes in the shape of the waveform can indicate the locus of stimulation has changed or a different conduction pathway was followed. It is no different when analyzing the QRS complex. The difference is that in step 3, we were looking at atrial activity. Now we are looking at ventricular activity.
- Measure from the beginning to the end of ventricular depolarization.
- The normal duration of the QRS complex is: 0.06 – 0.10 second
Close
- The previous slides presented the five-steps of rhythm analysis. These five steps must be followed regardless of how simple of complex the tracing is you are reviewing.
- The information gathered in these steps are telling a story.
- The title of that story is the interpretation.
Lesson #2: Ventricular Rhythms
Introduction Part 1
- Rhythms are often named according to the origin of the electrical activity in the heart or the structure where the problem is occurring.
- Ventricular Rhythms are aptly named due to the locus of stimulation being the ventricles (Purkinje network).
- Dysrhythmias in this category occur as a result of either a failure of the higher (faster) pacemakers within the heart or an abnormal locus of stimulation within the ventricles is occurring at a faster rate than the other pacemaker sites and thus takes over as the pacemaker of the heart.
- Remember, the fastest electricity in the heart (regardless of location) will dictate the heart rate.
Introduction Part 2
- Each rhythm in this category will share unique morphologic features which separate them from other rhythms.
- Other than Asystole and Ventricular Fibrillation which are unique even within this category, the remaining ventricular rhythms typically present without P waves and will display a wide, bizarre QRS complex (measuring 0.12 seconds or greater).
- After learning the unique features just described, it is simply a matter of recalling the heart rate range associated with the dysrhythmia.
Chart of Types
Ventricular Rhythms
(no P wave, wide - bizarre QRS if present)
| Rhythm | Rate |
| Asystole | 0 |
| Agonal | less than 20 bpm |
| Idioventricular | 20-40 bpm |
| Accelerated Idioventricular | 40-100 bpm |
| *Ventricular Tachycardia | > 100 bpm |
| *Ventricular Fibrillation | Electrical Chaos |
*Only two rhythms that are treated with defibrillation.
Lesson #3: Terminology 315
Part 1
Regardless of rhythm category, morphology of waveforms and pattern of occurrence are important aspects to include in an accurate interpretation.
Unifocal – abnormal complexes are of the same shape

Multifocal – abnormal complexes are of two or more different shapes. This indicates the impulse causing the PVC’s are coming from different locations.

Bigeminy – abnormal complexes occur every second complex

Trigeminy– abnormal complexes occur every third complex

Part 2
Regardless of rhythm category, morphology of waveforms and pattern of occurrence are important aspects to include in an accurate interpretation.
Quadrigeminy– abnormal complexes occur every fourth complex

Couplet – Two PVC’s together

Run of Ventricular Tachycardia
(V Tach) – Three or more PVC’s in a row at a rate of 100 bpm or greater. Also known as Triplet PVC’s or Salvo PVC’s

Lesson #4: Premature Ventricular Complexes (PVC's)
Description 1
- PVC rhythms may occur for a number of different reasons i.e., diet, fatigue, stress, disease, ischemia to name a few.
- Premature complexes frequently occur in bradycardic rhythms, but may occur almost any time.
- PVC’s occur when an early electrical impulse occurs from a location in either ventricle.

Description 2
- This early impulse causes an early cardiac complex which disrupts the underlying rhythm.
- The locus of stimulation being different, results in a change in the morphology of the cardiac complex.
- Note the absence of P wave and the wide, bizarre QRS complex.
- PVC’s can occur occasionally or frequently.
- PVC’s can be observed with or without a pattern

PVC EKG Strip

Analyze this tracing using the five steps of rhythm analysis.
Show Answer
- Rhythm: Irregular
- Rate: 60
- P Wave: upright and uniform, absent on early complex
- PR interval: 0.16 sec
- QRS: 0.08 sec, early complex wide and bizarre 0.16 sec
- Interpretation: Sinus Rhythm (NSR) with PVC
Lesson #5: Agonal Rhythm
Description
- This is a life-threatening dysrhythmia. Agonal rhythm is often the last ordered semblance of organized electrical activity in the heart prior to death.
- Heart rate is less than 20 bpm, without P waves and a wide, bizarre QRS complex.
- The rate is often so slow, that on a singular six-second rhythm strip it will be impossible to determine whether the rhythm is regular or irregular. There must be at lest three complexes on the tracing to make this call. Many times there will only be one or two complexes captured on the ecg strip.

Practice Strip

Analyze this tracing using the five steps of rhythm analysis.
Show Answer
- Rhythm: Cannot determine (only two complexes)
- Rate: 20 (using the six-second technique)
- Rate: 14 (using the 1500 technique – 110 small boxes/1500)
- P Wave: absent
- PR interval: n/a
- QRS: Wide and bizarre 0.20 sec
- Interpretation: Idioventricular Rhythm
Lesson #6: Idioventricular Rhythm
Description
- The morphologic features continue with the dysrhythmia. No P wave, wide and bizarre QRS.
- The heart rate is between 20 – 40 bpm.

Practice Strip

Analyze this tracing using the five steps of rhythm analysis.
Show Answer
- Rhythm: Regular
- Rate: 34
- P Wave: absent
- PR interval: n/a
- QRS: Wide and bizarre 0.24 sec
- Interpretation: Idioventricular Rhythm ECG
Lesson #7: Accelerated Idioventricular Rhythm
Description
- The morphologic features continue with the dysrhythmia. No P wave, wide and bizarre QRS.
- The heart rate is between 40 – 100 bpm.
- Note the abnormal shape and width of the QRS complexes.
- Patients with this dysrhythmia may actually be hemodynamically stable when the heart rate is within the “normal” range. This rhythm must always be reported whether the patient can tolerate it or not.

Practice Strip

Analyze this tracing using the five steps of rhythm analysis.
Show Answer
- Rhythm: Regular
- Rate: 41
- P Wave: absent
- PR interval: n/a
- QRS: Wide and bizarre 0.16 sec
- Interpretation: Accelerated Idioventricular Rhythm
Lesson #8: Ventricular Tachycardia
Description
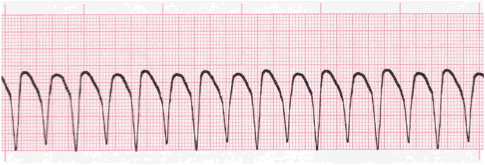
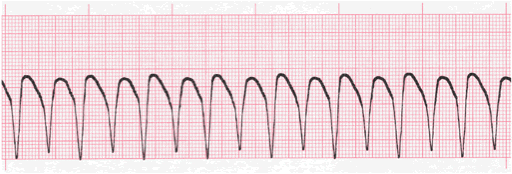
- The morphologic features continue with the dysrhythmia. No P wave, wide and bizarre QRS.
- Ventricular Tachycardia occurs when the rate exceeds 100 bpm.
- Approximately 50% of patients become unconscious at the onset of ventricular tachycardia.
- Although patients in V Tach may be treated with a defibrillator, not all patients in Ventricular Tachycardia require this level of treatment.
- Depending upon their level of consciousness and blood pressure. The patient may be treated with medications, synchronized cardioversion or in the worst case scenario a defibrillator and BLS/ACLS response.
- This rhythm must always be reported whether the patient appears stable or not. (Follow your local reporting and treatment protocols)
Practice Strip
Analyze this tracing using the five steps of rhythm analysis.
Show Answer
- Rhythm: Regular
- Rate: 150
- P Wave: absent
- PR interval: n/a
- QRS: Wide and bizarre
- Interpretation: Ventricular Tachycardia
Lesson #9: Ventricular Fibrillation
Description
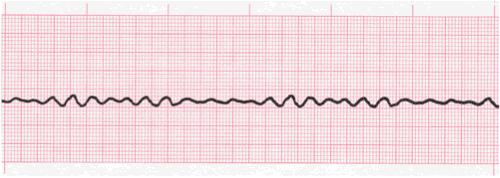
- The morphologic features are different with this dysrhythmia. No P wave and no QRS complexes. This rhythm presents with a chaotic waveform which reflects the electrical chaos occurring within the heart.
- The heart is not actually beating as we know it. The chaos occurs as a result of small regions of tissue which are independently depolarizing.
- This rapid disorganized electrical activity actually makes the heart appear to quiver in response to this activity. Some have described it as shaking like Jello.
- Fibrillatory waves may be coarse or very fine. This is based upon their size. The longer V Fib occurs, the smaller the waveforms are likely to be.
- (Description continues on next slide)

Description (continued)
- Coarse Ventricular Fibrillation (coarse V Fib) is when a majority of the waveforms measure 3 mm or greater
- Fine V Fib (fine vfib) is when a majority of the waveforms measure less than 3 mm
- This is absolutely a life-threatening dysrhythmia which requires, immediate, effective, and aggressive care.
- (Follow your local reporting and treatment protocols)
- If your patient is talking to you when you see this on the monitor, then your patient is not in V Fib. Always, check your patient first, but there will likely be a loose or disconnected lead wire or electrode.

VFib Practice Strip
Analyze this vfib rhythm strip using the five steps of rhythm analysis.
Show Answer
- Rhythm: Irregular
- Rate: Unable to determine
- P Wave: absent
- PR interval: absent
- QRS: absent
- Interpretation: Ventricular Fibrillation (Fine)
Lesson #10: Asystole
Description of Asystole ECG
- Asystole dysrhythmia occurs when there is a total absence of electrical activity in the heart.
- The patient is clinically dead.
- Sometimes this tracing is referred to as straight line or flat line.
- There will be an absence of P waves and QRS complexes.
- True Asystole is an absolute medical emergency.
- (Follow your local reporting and treatment protocols)
- If your patient is speaking to you, they are NOT in Asystole. Check your attachments and equipment.

Practice Strip

Analyze this tracing using the five steps of rhythm analysis.
Show Answer
- Rhythm: Absent
- Rate: 0
- P Wave: absent
- PR interval: n/a
- QRS: absent
- Interpretation: Asystole
Lesson #11: Ventricular Asystole
Ventricular Asystole
- Another form of Asystole you may encounter is called Ventricular Asystole.
- The features are the same as traditional Asystole, with one exception.
- There will be P waves present in this tracing.
- The patient is clinically dead. The patient will not survive with just atrial depolarization.
- (Follow your local reporting and treatment protocols)

Practice Strip

Analyze this tracing using the five steps of rhythm analysis.
Show Answer
- Rhythm: Regular
- Rate: Atria – 52, Ventricles - 0
- P Wave: Upright and uniform
- PR interval: absent
- QRS: absent
- Interpretation: Ventricular Asystole
Lesson #12: Quiz Test Questions 315


